Bunge × Viterra — Synergy Estimation
Operational and procurement synergy analysis for Bunge Limited’s merger with Viterra, quantifying logistics and network optimization efficiencies across global supply chains.

Objective
To evaluate post-merger synergies between Bunge Limited and Viterra by modeling logistics optimization, procurement consolidation, and operational scale benefits. The project aimed to quantify efficiency gains in shipping, storage, and agricultural commodity processing while assessing potential risks to network resiliency.
Methodology
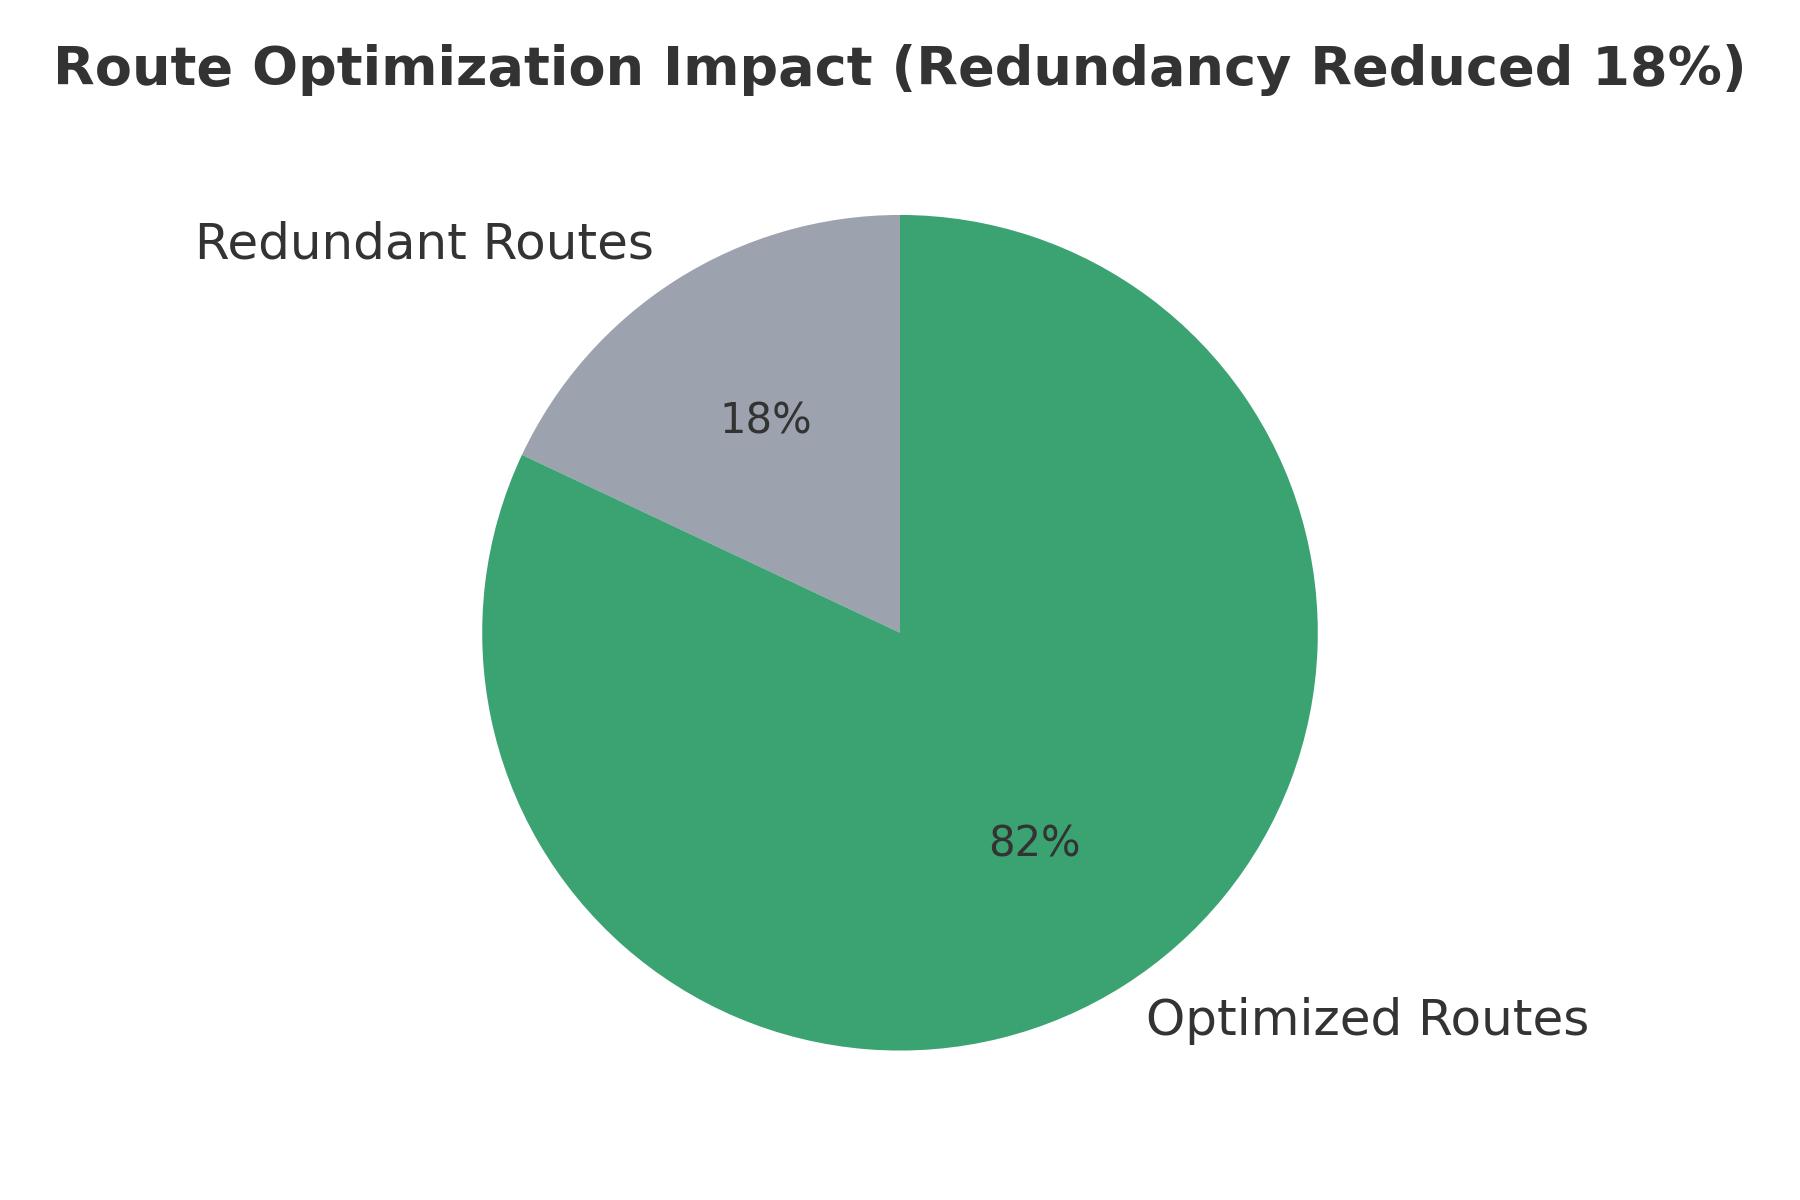
- Conducted supply chain network modeling using a hub-and-spoke framework to identify redundant routes and potential optimization points.
- Performed procurement consolidation analysis for bulk commodities, fuel contracts, and packaging materials across 35 global facilities.
- Applied scenario-based sensitivity analysis to test CAPEX, freight, and OPEX reductions under conservative and aggressive integration assumptions.
- Benchmarked logistics throughput KPIs and lead-time efficiencies using publicly available 2023 performance data from both firms.
Key Findings
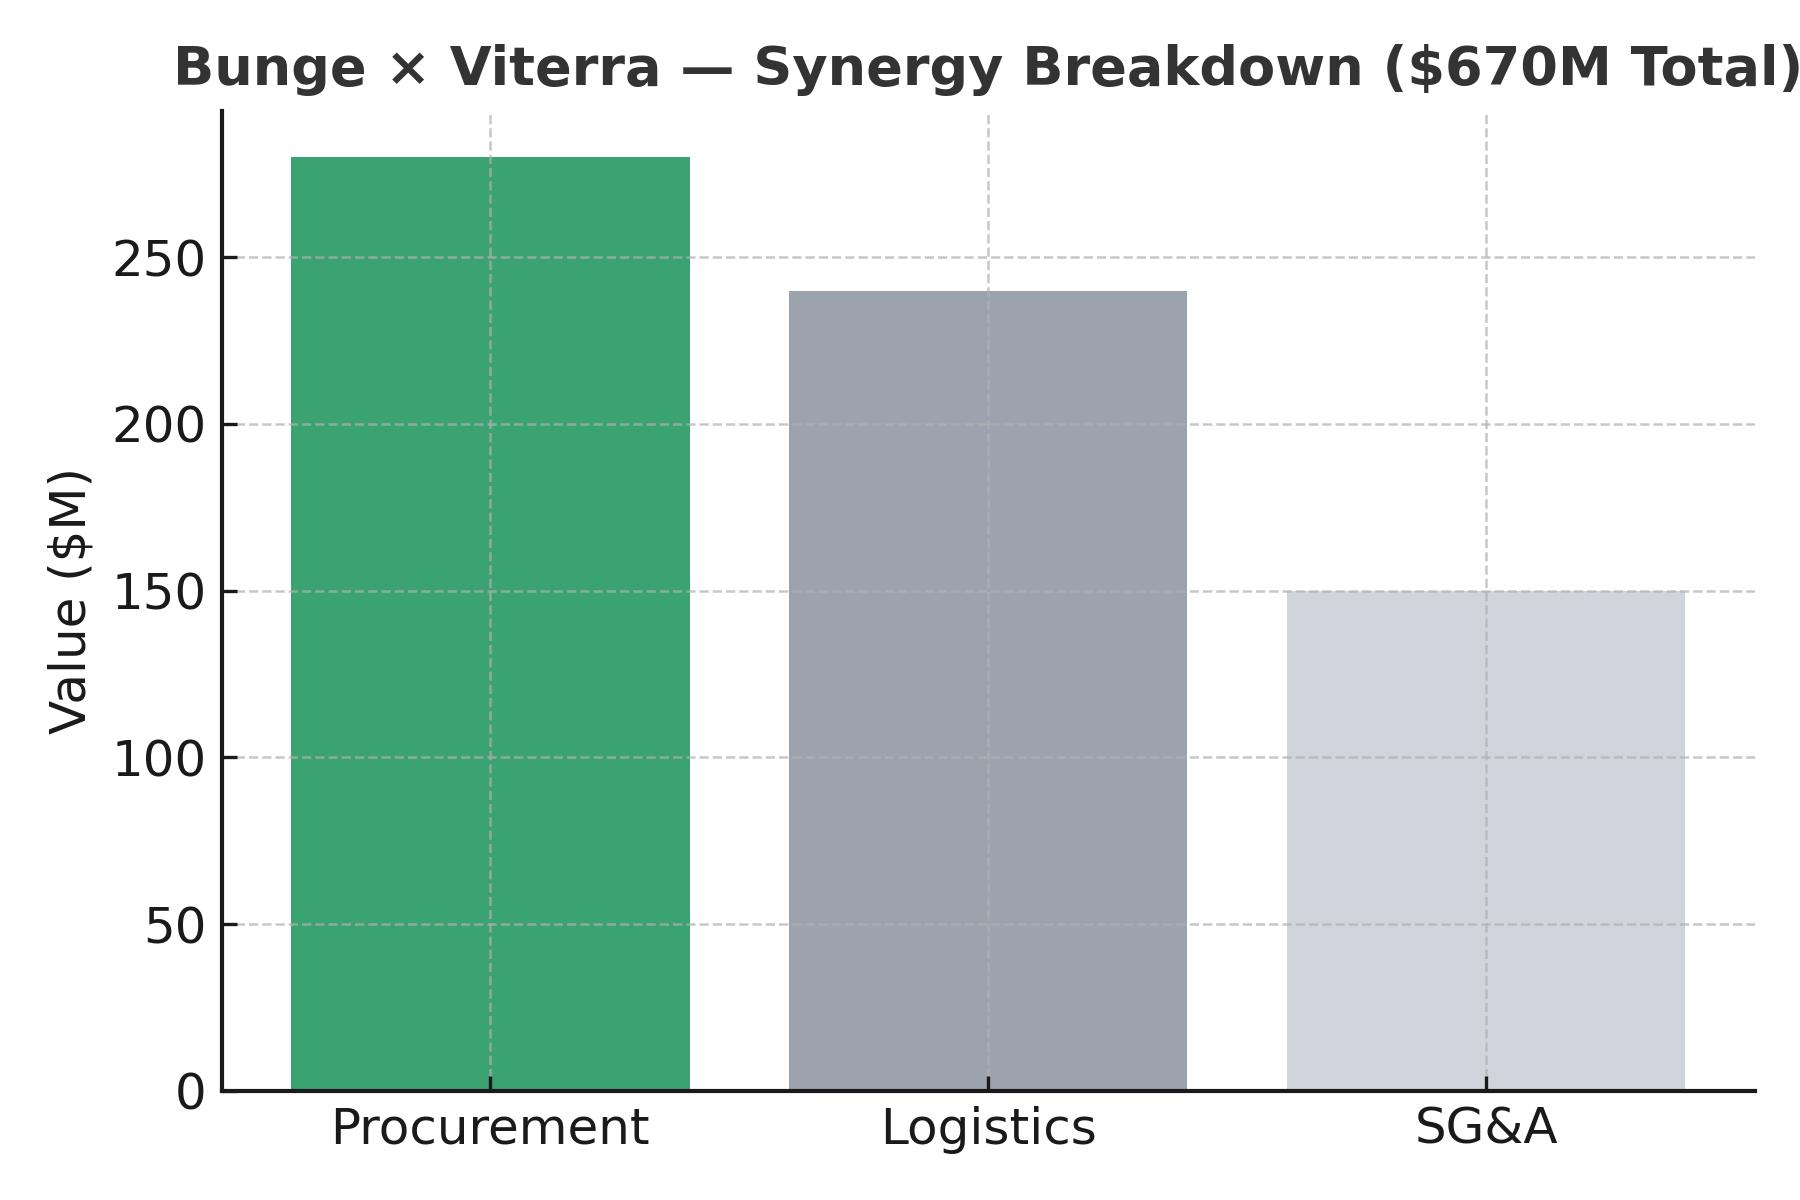
- Total estimated synergy potential: $670 million annually (Procurement: $280M, Logistics: $240M, SG&A: $150M).
- Optimization reduced redundant maritime routes by 18%, cutting average freight costs by 9%.
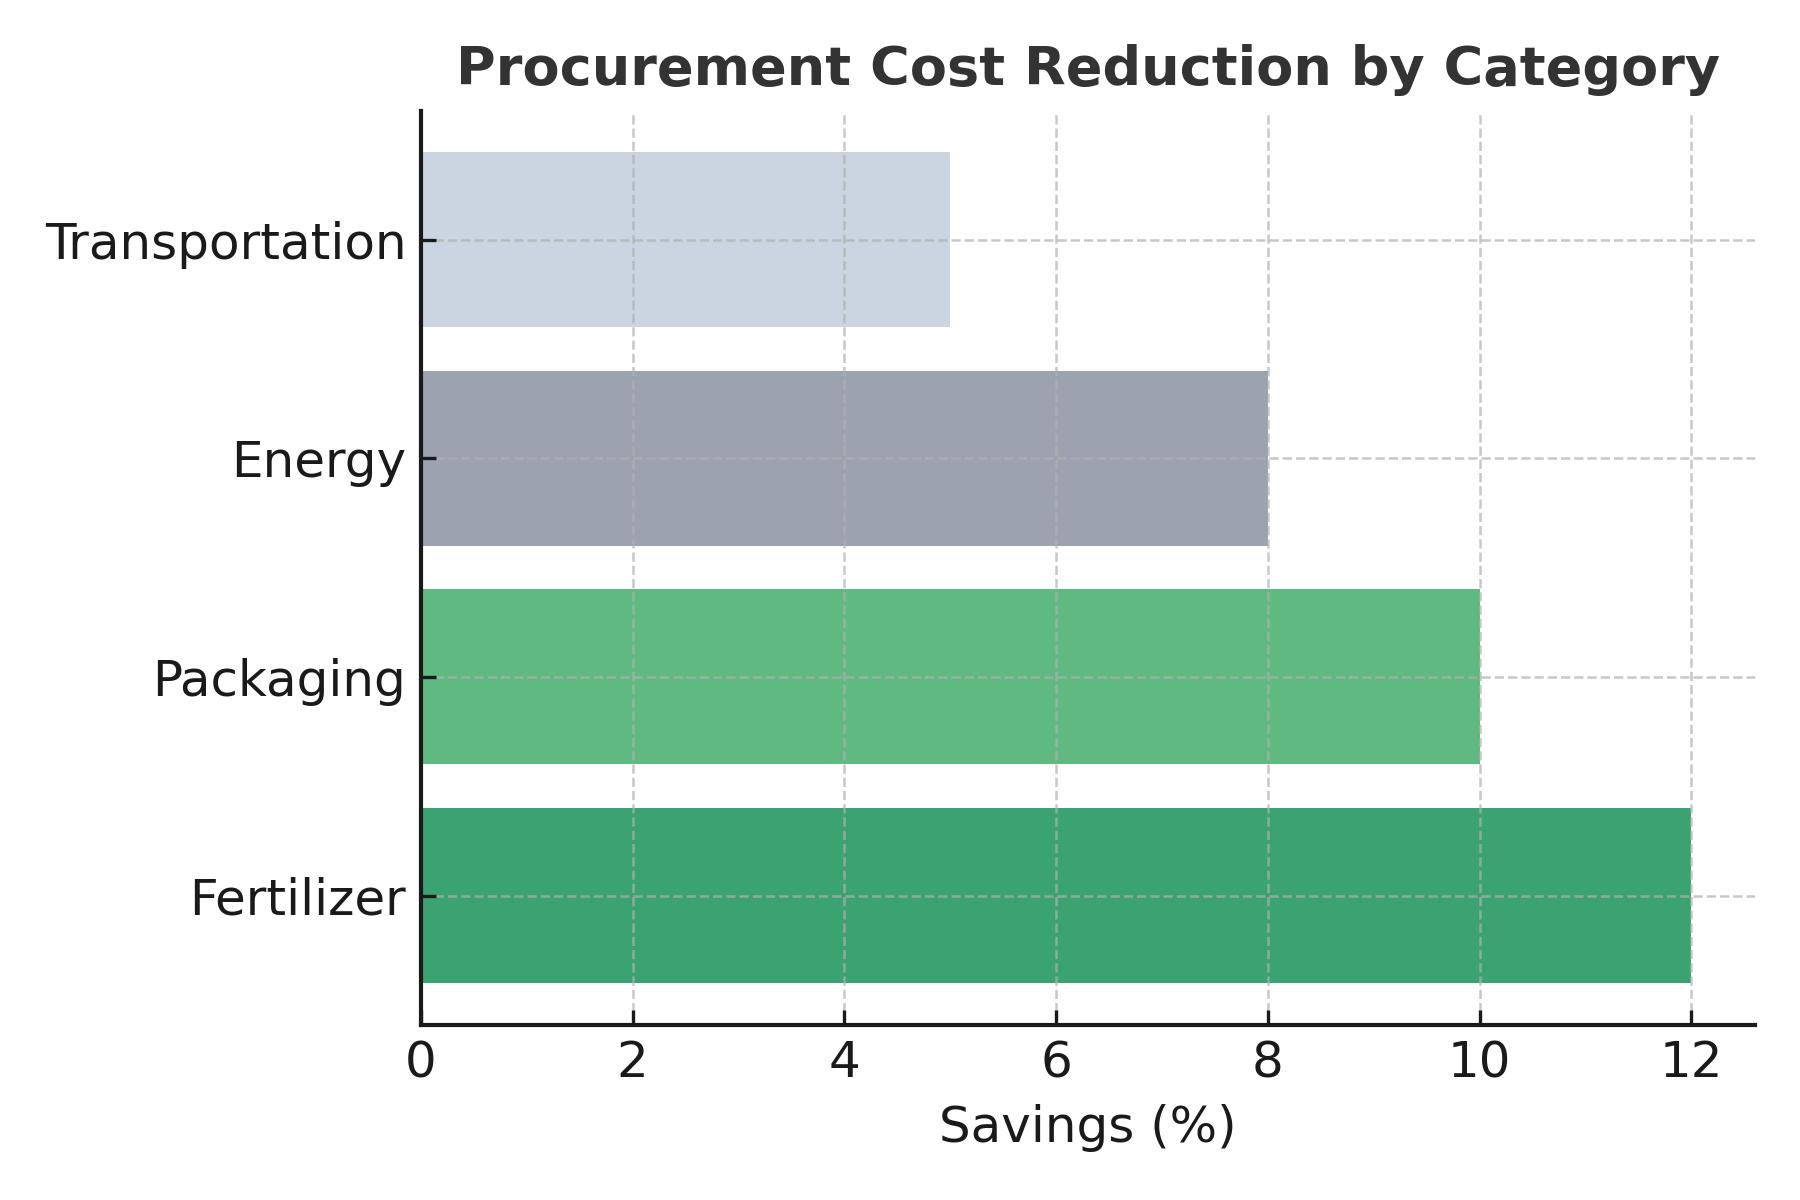
- Procurement consolidation achieved 15% cost reduction in key input categories (fertilizer, packaging, energy).
- SG&A and back-office unification projected savings of $150M through shared service centers and ERP integration.
Strategic Insights
- Vertical Integration: Enhanced grain origination control through combined infrastructure, improving risk hedging and pricing stability.
- Global Reach: Bunge’s oilseed assets complement Viterra’s grain export terminals, expanding geographic diversification.
- Operational Efficiency: Reduced demurrage costs and inventory turnover cycles through improved scheduling algorithms.
- Risk Considerations: Identified 12 critical nodes with over 80% throughput dependency—requiring phased integration to avoid bottlenecks.
Procurement Efficiency
Procurement savings were achieved primarily through contract consolidation and volume-based negotiation leverage. Fertilizer and packaging materials offered the highest reduction potential, driving an average 12% cost saving across categories.