AdventureWorks Power BI Dashboard
End-to-end BI solution for performance monitoring — revenue, profit, and return trends visualized for executive decision-making.
Objective
To design an interactive Power BI report enabling executives to assess sales performance, profitability, and customer behavior with automated refresh and standardized KPIs.
Data Preparation
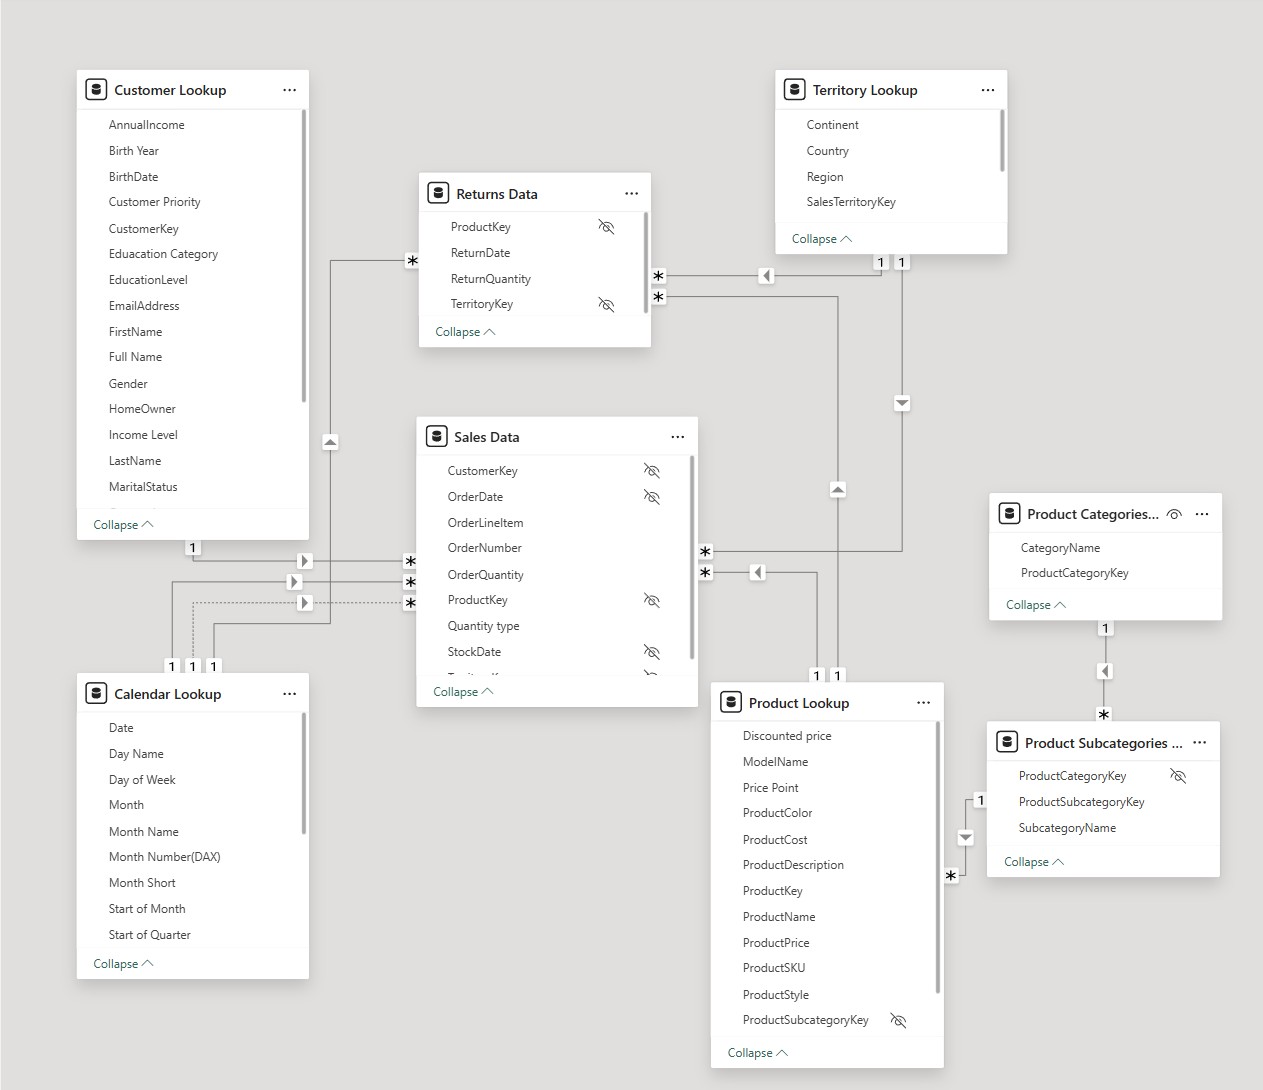
- Cleaned and transformed data from multiple tables (Sales, Customers, Products, Geography, Returns) in Power Query.
- Built a star schema for relational consistency and optimal performance.
- Standardized key measures — Revenue, Profit Margin, Return Rate — through reusable DAX formulas.
Modeling & DAX Implementation
- Created calculated measures for
Total Revenue,Total Profit, andReturn Rate. - Implemented time intelligence for MoM, YoY, and rolling averages.
- Added dynamic Top-N and category drill-throughs for exploration.
Dashboard Design
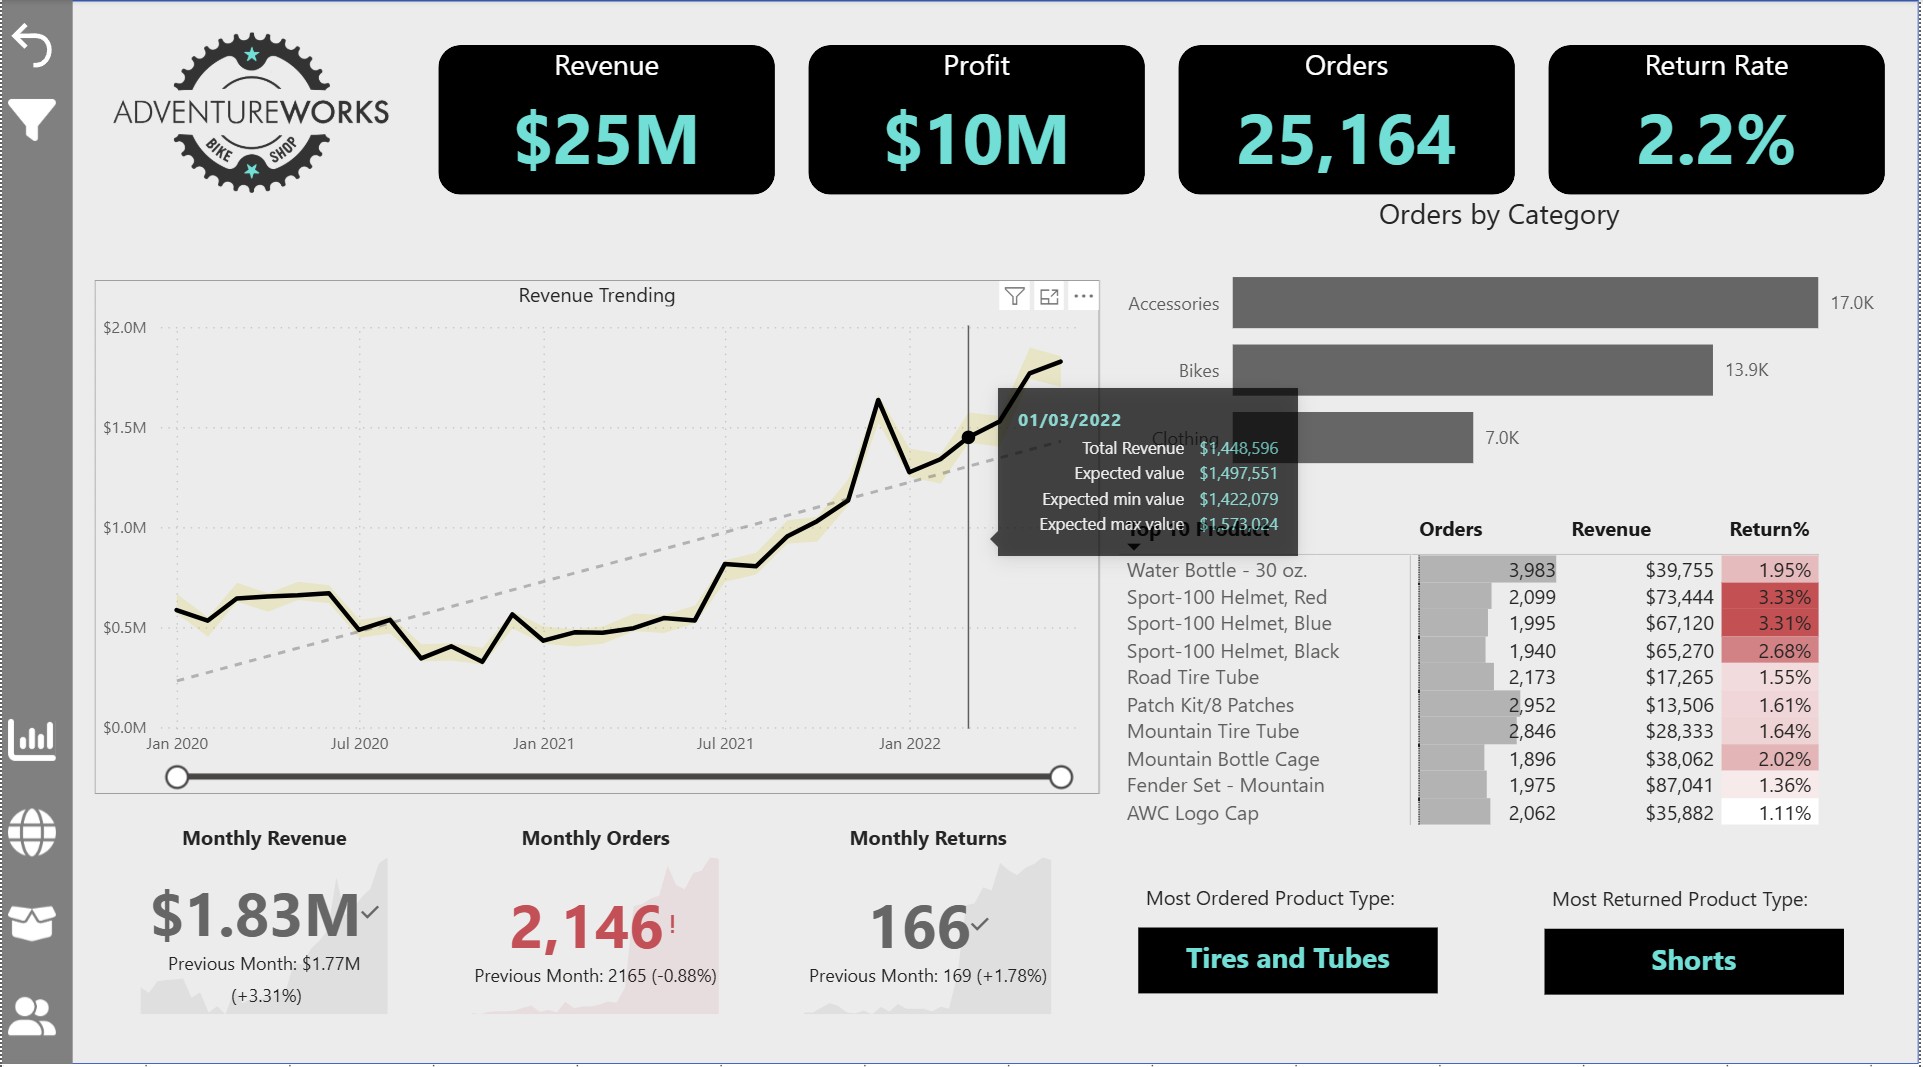
- Executive Overview: Revenue, Profit, Return KPIs with MoM/YoY indicators.
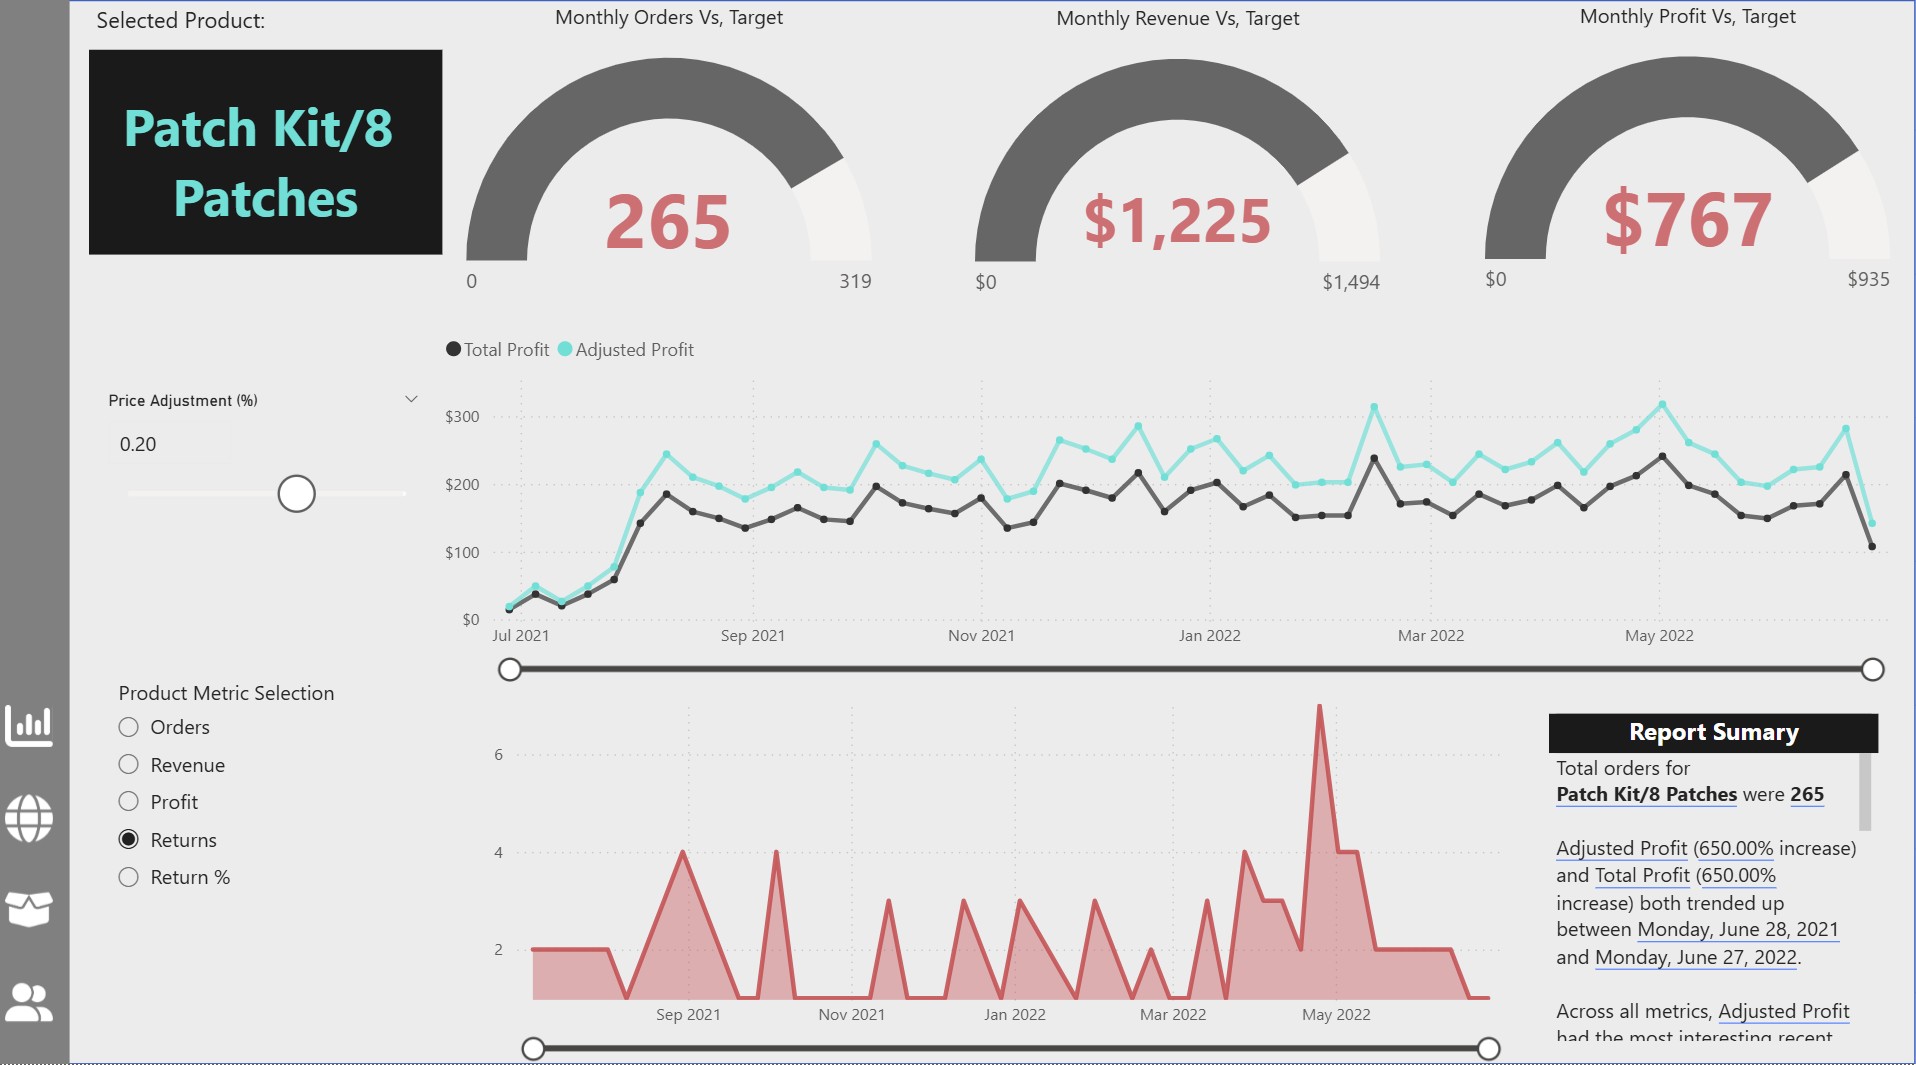
- Product Performance: Category and subcategory profitability.
- Customer Insights: Segmentation by region, AOV, and repeat purchase rates.
Key Insights
- Total Revenue: $25M | Profit: $10M | Return Rate: 3.8%.
- Top 10 SKUs contributed to 68% of profits — guiding assortment focus.
- Pacific region sales grew 12% YoY due to digital channel expansion.
- Automated data refresh reduced reporting time by 70%.